Statistics
Section for deep analytics of all campaigns, offers and traffic sources with advanced filtering and grouping capabilities.
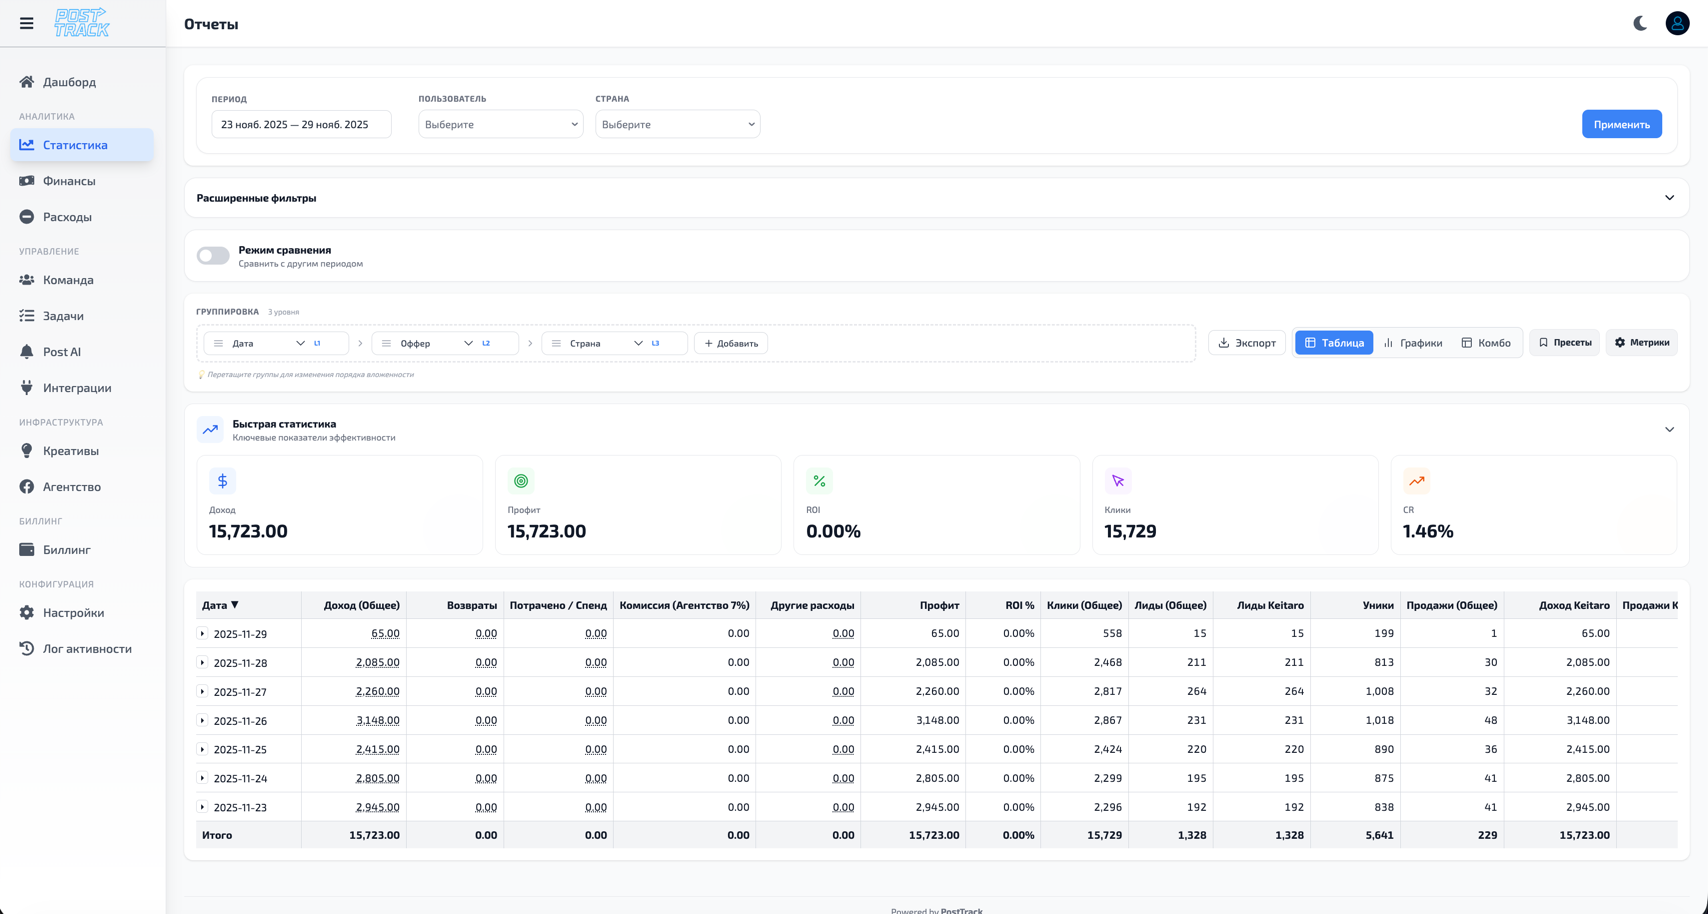
Main Features
Statistics Table
Displayed data:
- Offer/campaign name
- Clicks
- Unique clicks
- Leads
- Deposits (FTD)
- Expenses
- Revenue
- Profit
- ROI (%)
- CR (conversion)
- EPC (earnings per click)
- CPC (cost per click)
- CPL (cost per lead)
Filters
By period:
- Today / Yesterday
- Last 7 / 30 days
- Current month
- Last month
- Custom period (from-to)
By parameters:
- Offers
- Geo (countries)
- Traffic sources
- Users (buyers)
- Trackers
- Status (active/inactive)
Data Grouping
Group by:
- Offers
- Days / Weeks / Months
- Geo
- Users
- Traffic sources
- Trackers
Period Comparison
Capabilities:
- Compare with previous period
- Display change dynamics (↑↓)
- Percentage growth/decline of metrics
- Visual trend indicators
Working with Data
Export
Export formats:
- CSV
- Excel (XLSX)
- PDF report
- Via API
Saved Reports
Functions:
- Save filter settings
- Quick access to frequently used reports
- Report templates
- Automatic scheduled generation
Details
Drill-down capabilities:
- Click row → detailed statistics
- View data by days
- Detail to creative level
- Change history
Efficiency Analysis
Finding Problem Areas
Automatic alerts:
- Campaigns with ROI < 0
- High CPC without leads
- Conversion drop
- Anomalous expenses
Optimization
Recommendations:
- Best offers for period
- Geo with maximum ROI
- Optimal launch time
- Inefficient sources
Trends
Dynamics analysis:
- ROI change chart
- Lead dynamics
- Expense growth/decline
- Seasonality
Advanced Features
Custom Metrics
Add own indicators:
- Calculation formulas
- Conditional formatting
- Custom columns
Segmentation
Create segments:
- By profitability
- By geography
- By traffic type
- By conversion
BI Integration
Connect:
- Google Data Studio
- Tableau
- Power BI
- Custom dashboards
Usage Tips
- Use saved reports for daily analysis
- Configure alerts for critical metrics
- Compare periods to understand trends
- Group data to identify patterns
- Export reports for presentations and meetings